1.2 Tutorial: Summarized visualizations.
Visualization of summary data (e.g. counts per category) follows the same principles as highlighted in “Tutorial: Subject-level graphs and tables”, some specifics are mentioned below.
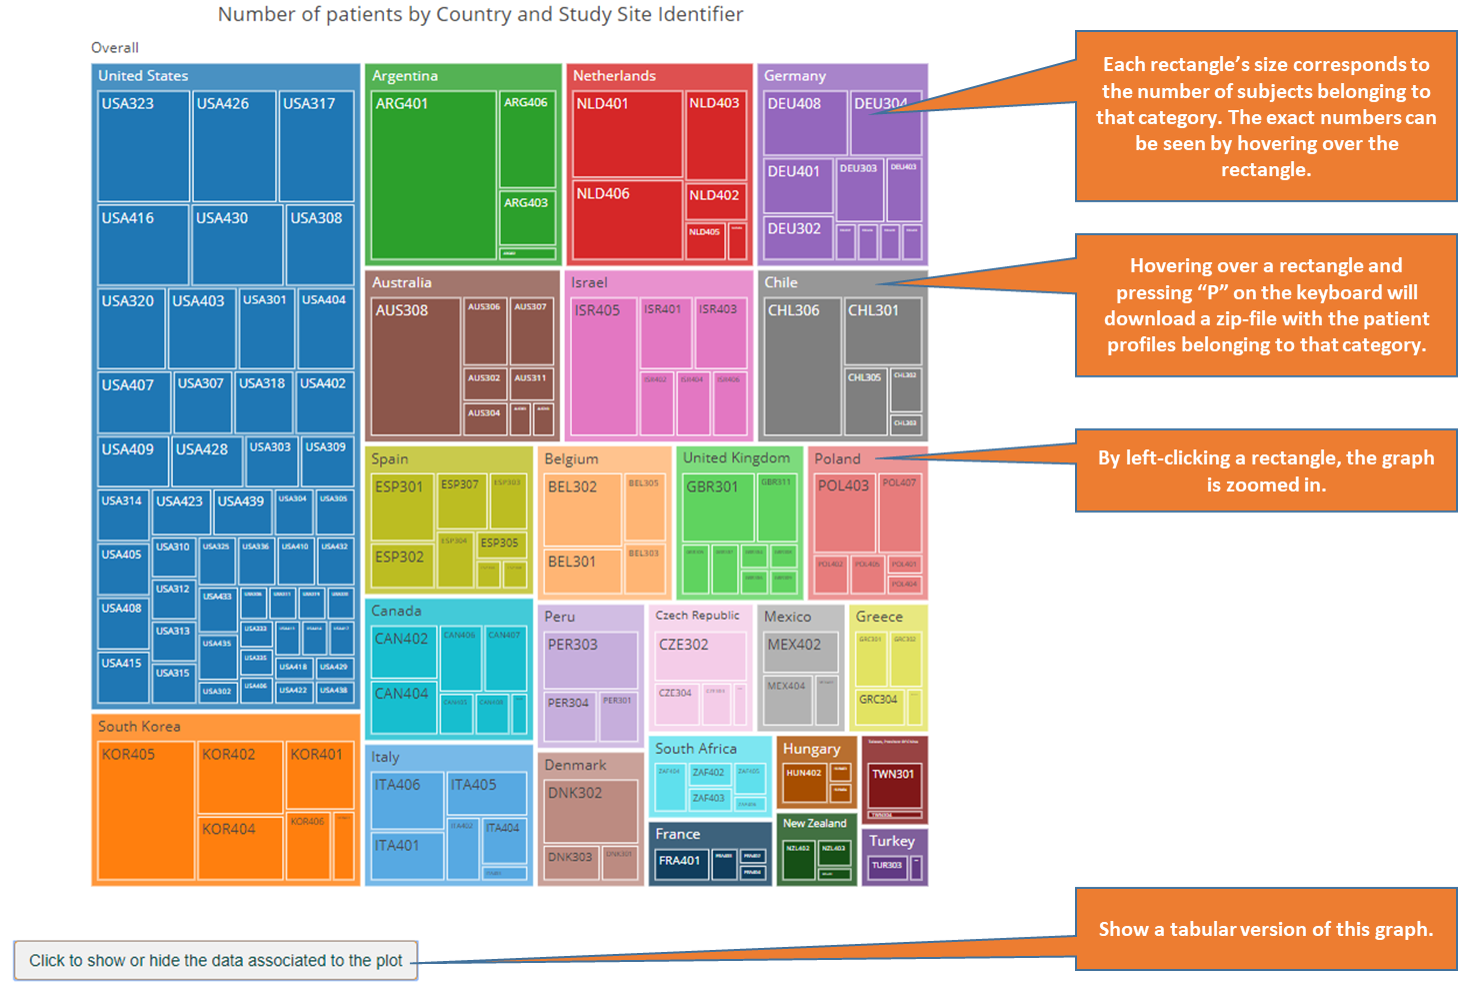
1.2.1 Treemap graphs
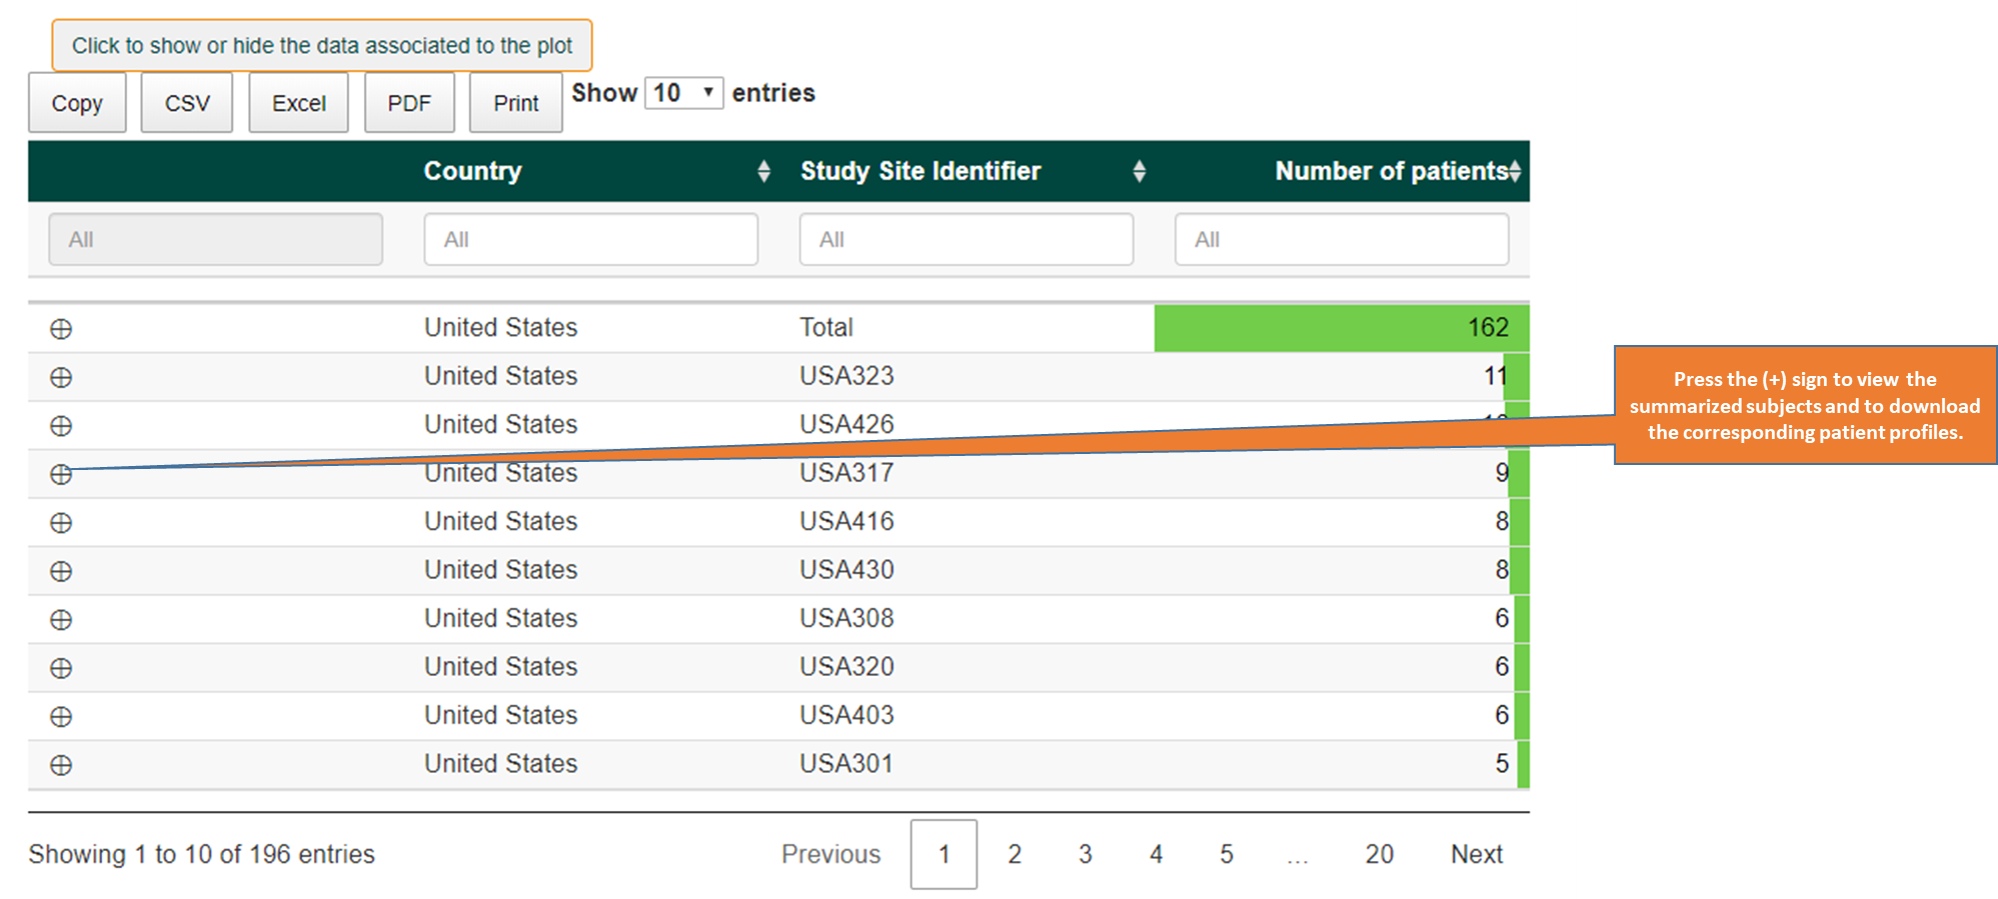
1.2.2 Summary tables