1.1 Tutorial: Subject-level graphs and tables
Subject-level analyses (e.g. spaghettiplots, shiftplots, eDISH,…) are represented with crosslinked interactive graphs and tables. Patient profiles can be opened from the graphs as well as the tables. More detailed instructions can be found in the screenshots below.
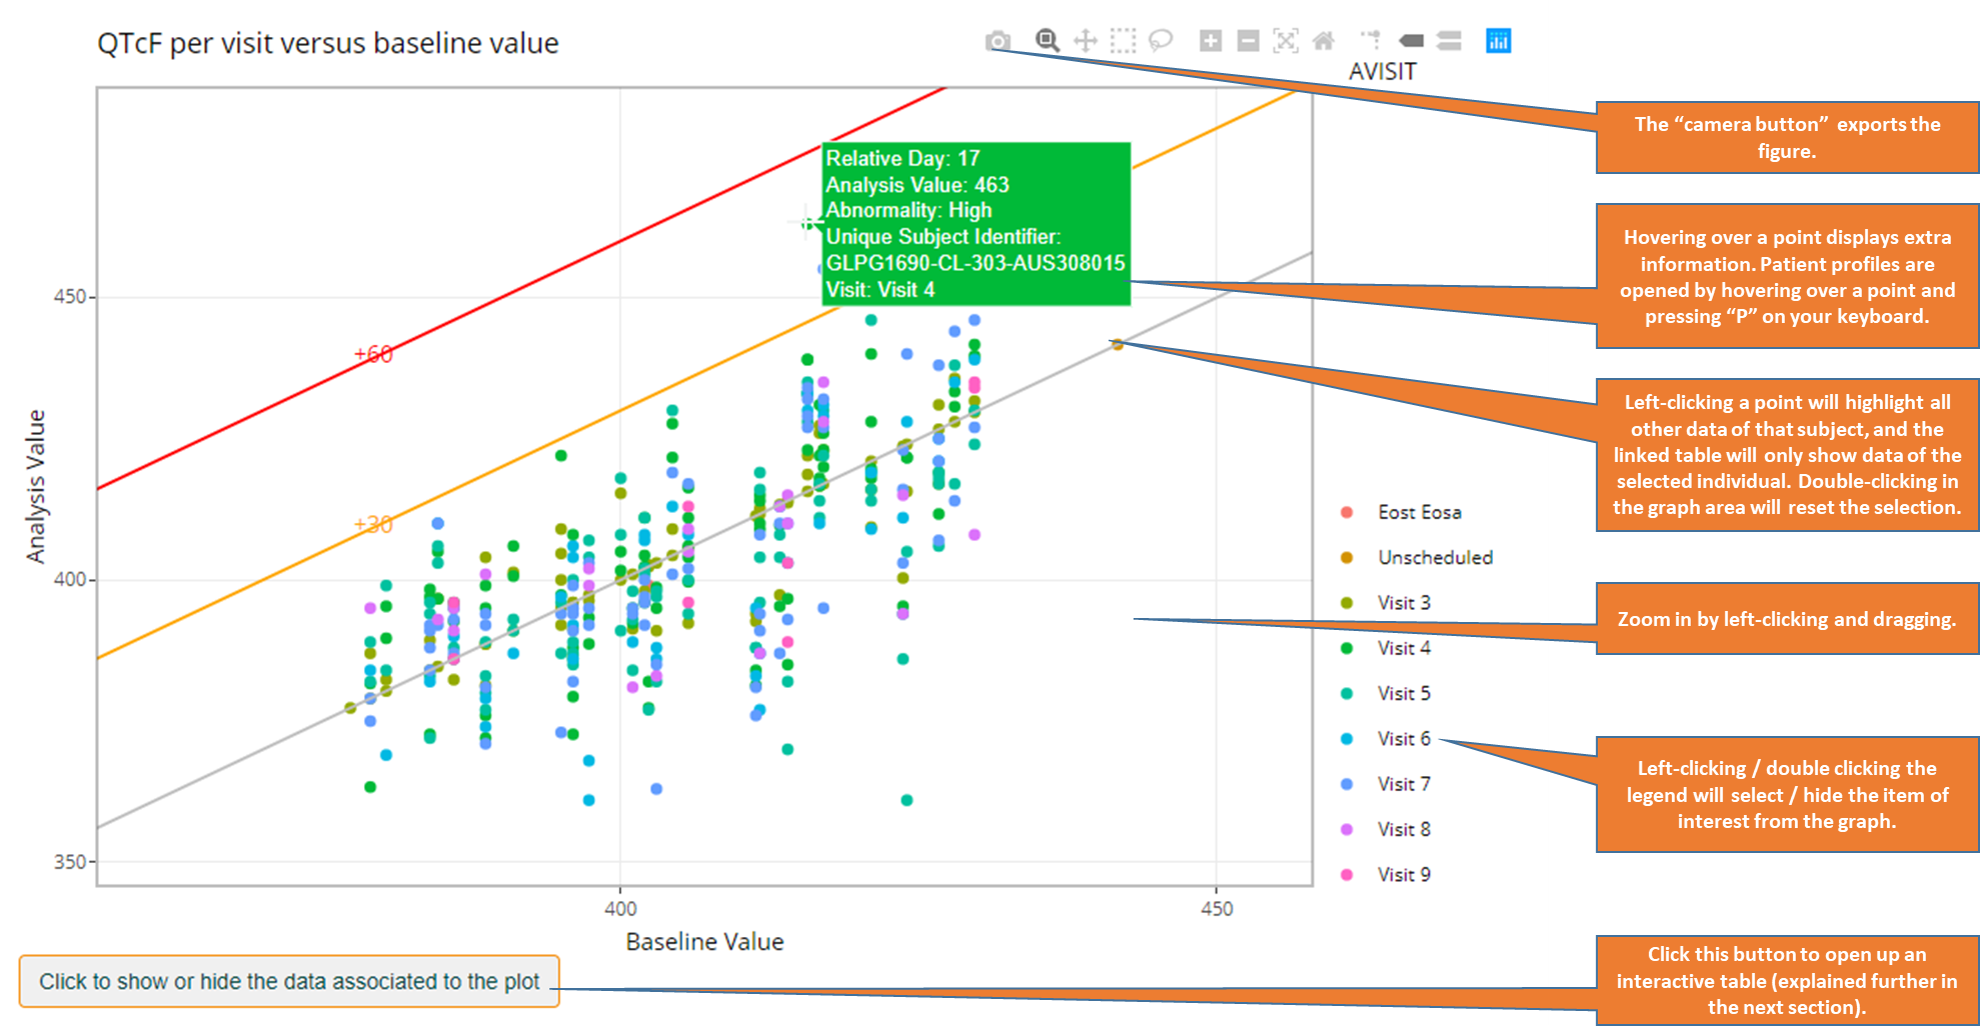
1.1.1 Scatter plots and spaghetti plots
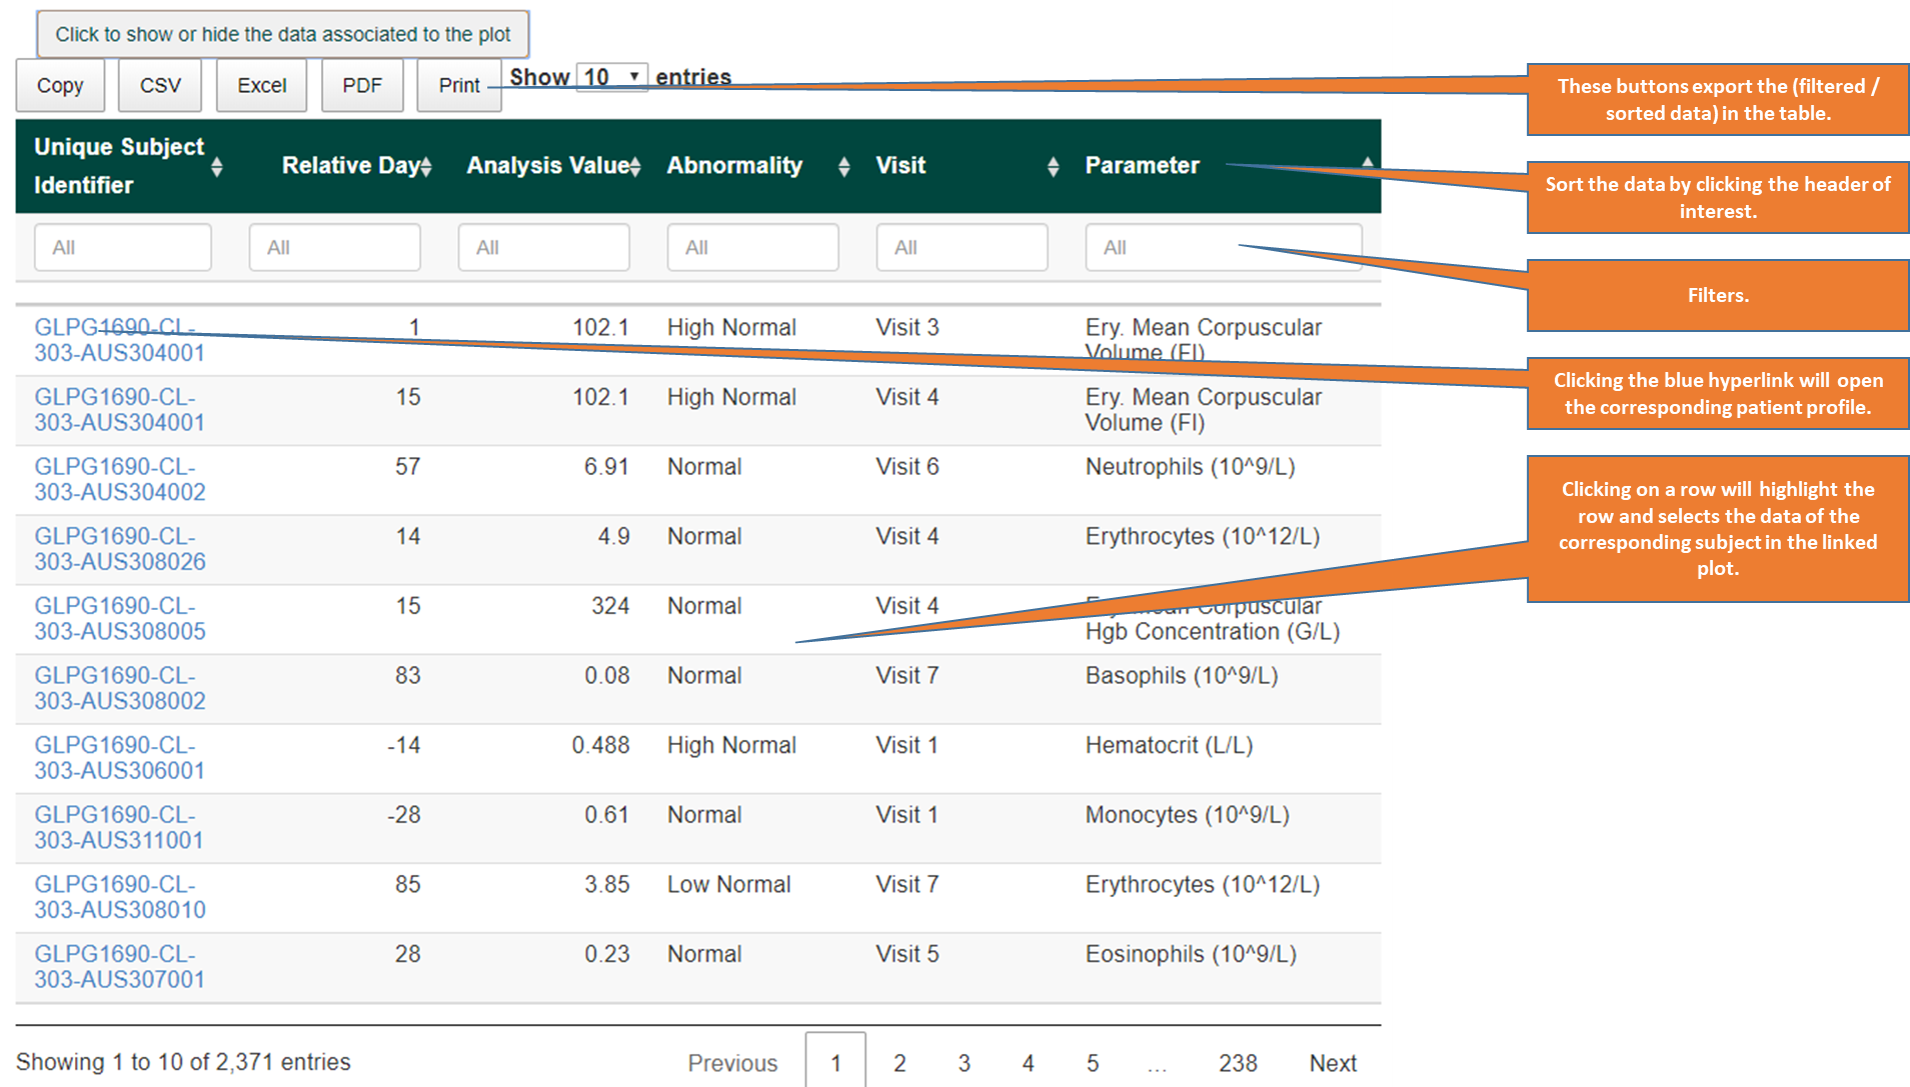
1.1.2 Linked tables