1.2 Tutorial: Summarized visualizations and tables
Summary data (e.g. counts per category) are displayed in interactive summary
visualizations and tables. They follow the same
principles as highlighted in the previous section.
Functionalities specific of these visualizations and tables are mentioned in
the sections below.
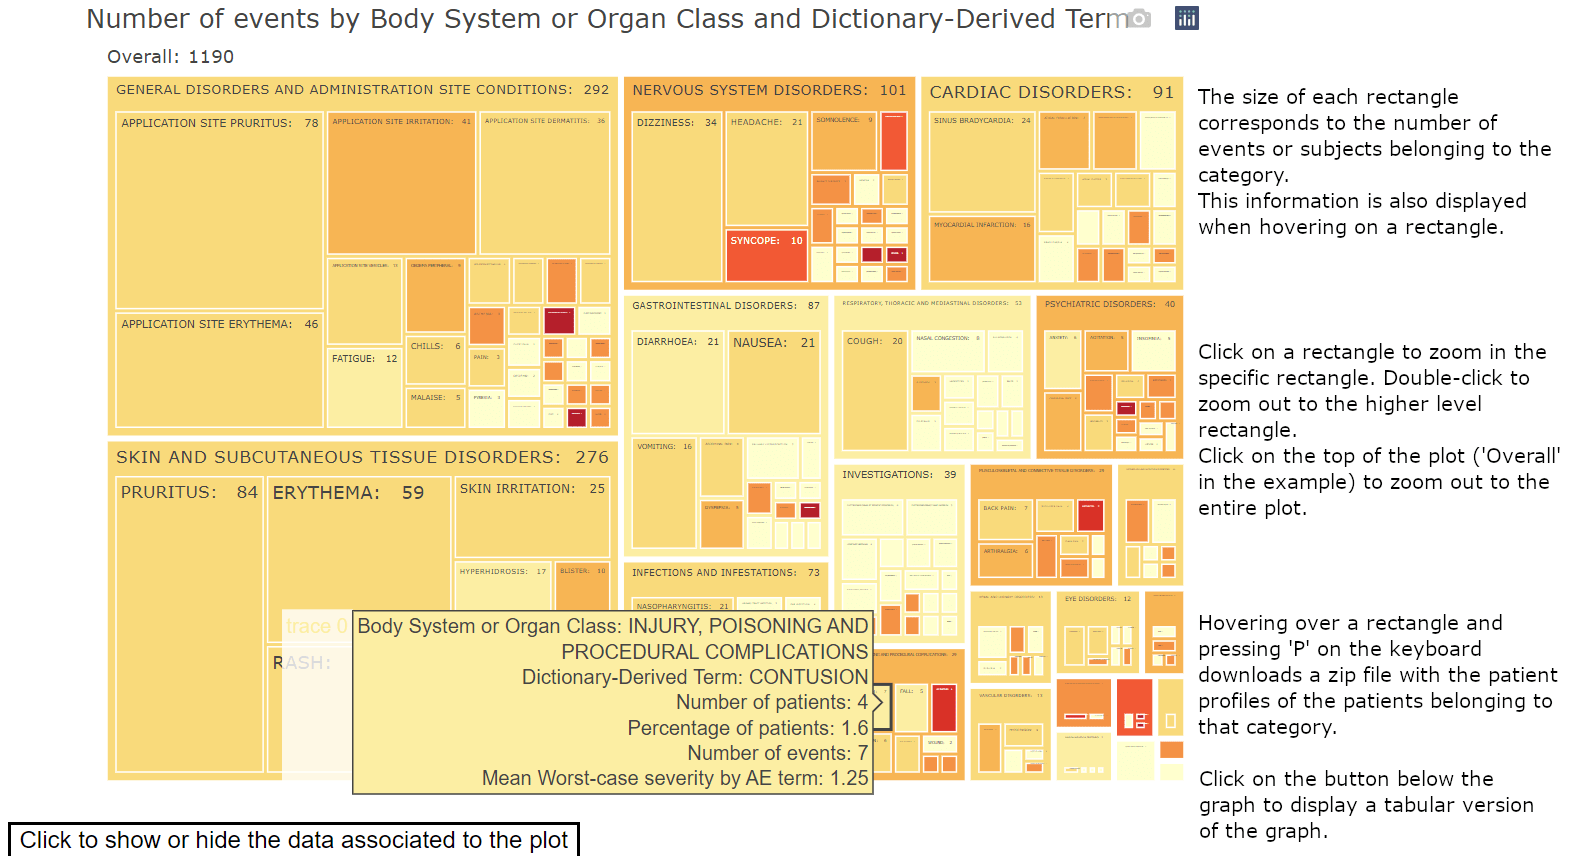
1.2.1 Summary plots
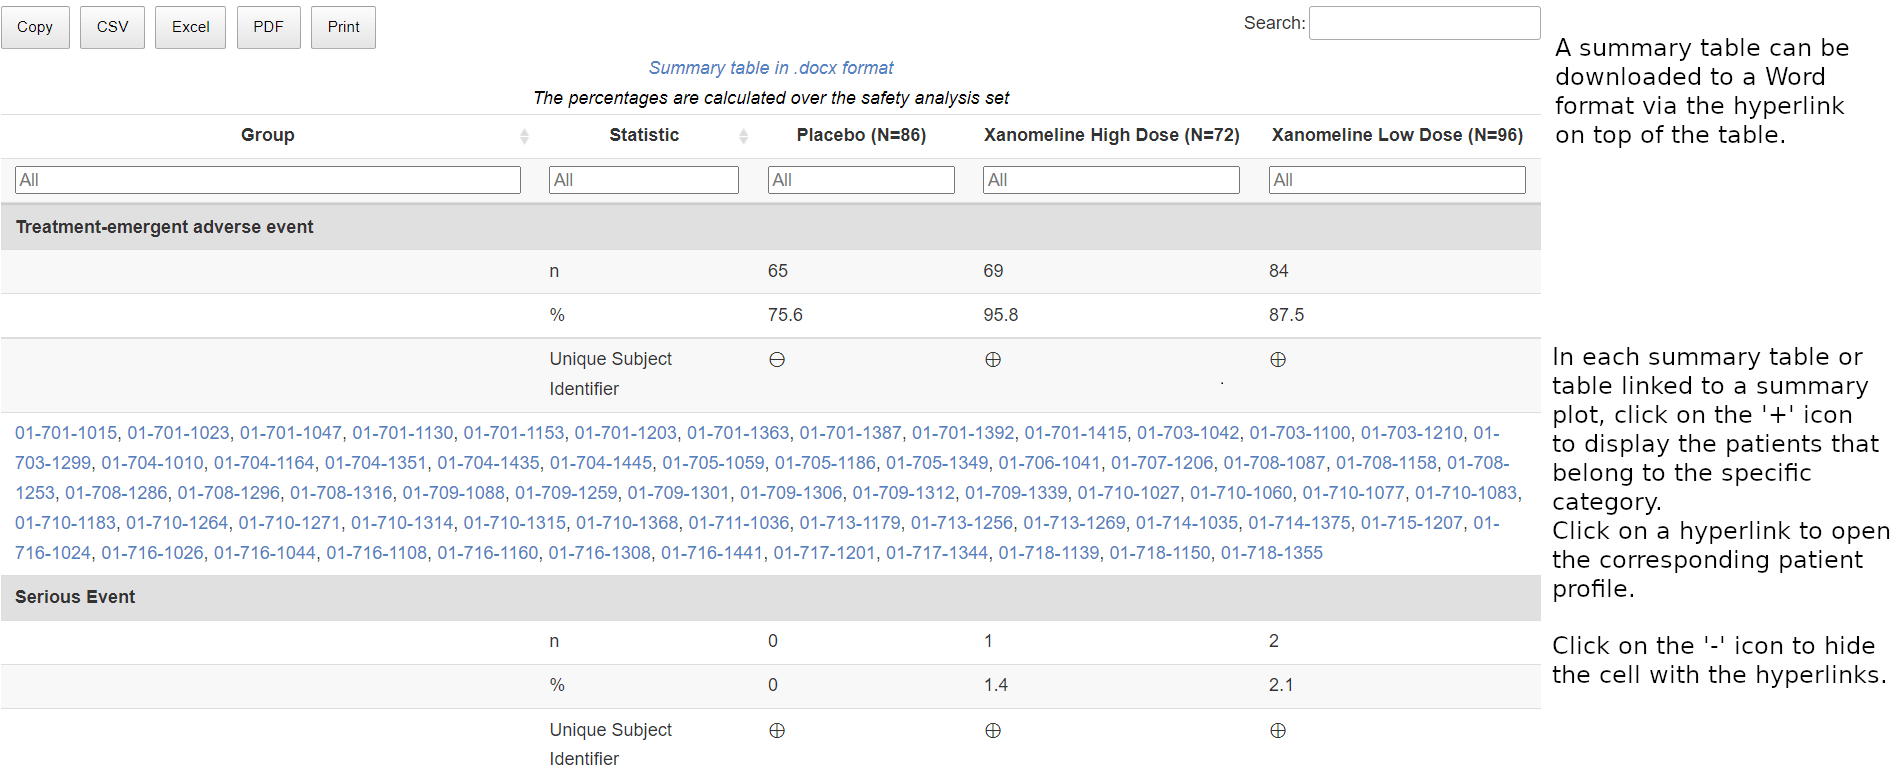
1.2.2 Summary tables